We use strictly necessary storage to run this site and to credit the partner who referred you. With your consent we also use Google Analytics cookies to see how the site is used and which campaigns work. See our Cookie Policy for details.
Net Profit and Monthly Income for the Self-Employed
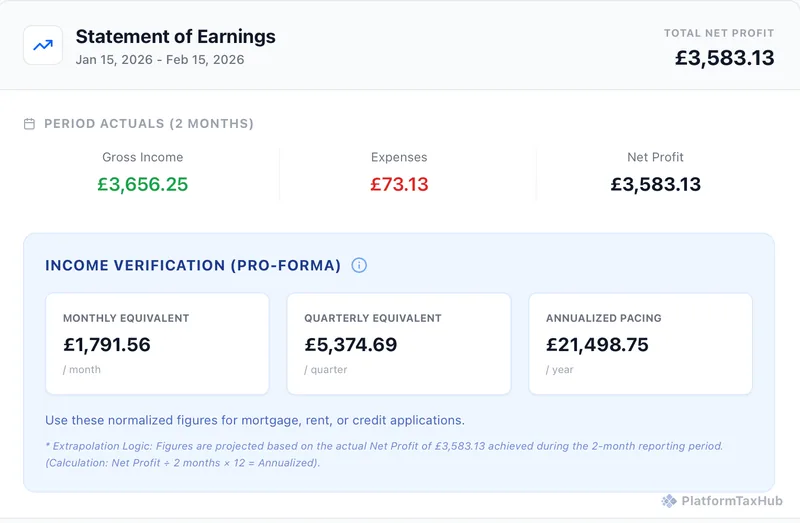
Net Profit & Financial Insights takes expenses off income from every platform and currency, then normalises the net profit into a fixed monthly figure, extrapolated to a quarter and a year. It downloads as a Statement of Earnings: a profit and loss statement drawn from tracked records, not a pay stub typed into a template.
Tracking works in any country. Tax estimates are live in the US, UK and Nigeria, with more countries coming soon. Check your country.
Why Bank Statements Don't Show Self-Employed Income
A bank statement shows deposits, not income. Platform payouts arrive with fees already taken, in different amounts, currencies and dates, while the expenses behind them sit elsewhere. Month to month the figure swings, and nowhere does it show net profit or what the income amounts to over a month, a quarter or a year. A pay stub generator does not fill the gap: its figures are typed into a template, with no records behind them.
Everything you need to take control
Net Profit
income from every platform and currency, less platform fees and expenses, in one reporting currency.
Monthly Equivalent
net profit spread evenly across the months it was earned in, so uneven months read as one fixed monthly figure.
Quarterly Equivalent and Annualised Pacing
the monthly equivalent taken to a quarter and a full year, extrapolated when the records cover less than twelve months.
Statement of Earnings
a profit and loss statement for a set period, with the normalised figures, a month-by-month table and every transaction behind the totals, downloaded as a PDF.
Income Stability
months with income, months in a row, and how far monthly income swings, scored out of 100.
Year on Year
one calendar year's net profit against the year before.
Pay Yourself Calculator
AI splits monthly net profit into take-home pay, tax reserve, cash buffer and reinvestment, with the reasoning behind each share.
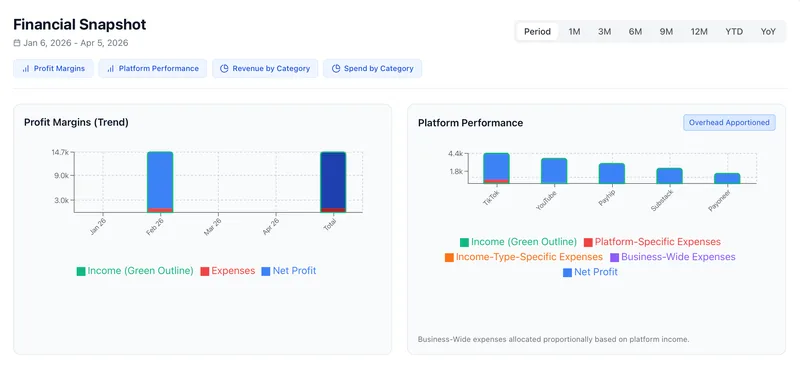
Financial Snapshots
income, expenses and net profit month by month, by platform and by category.
Profit by Income Category
each kind of income against the costs it caused, with overheads shared across them by revenue share, showing which streams actually earn.
See It In Action
How It Works
Aggregate
Income and expenses come from the Income and Expense Trackers, across every platform and currency.
Calculate Net
Platform fees and expenses come off income to give net profit for the period.
Normalise & Download
Net profit becomes a monthly equivalent, extrapolated to a quarter and a year, and downloads as a Statement of Earnings.
Net Profit & Financial Insights
Income Tracker included automatically. Tax & Compliance is a separate product; the Bundle takes both together for less.